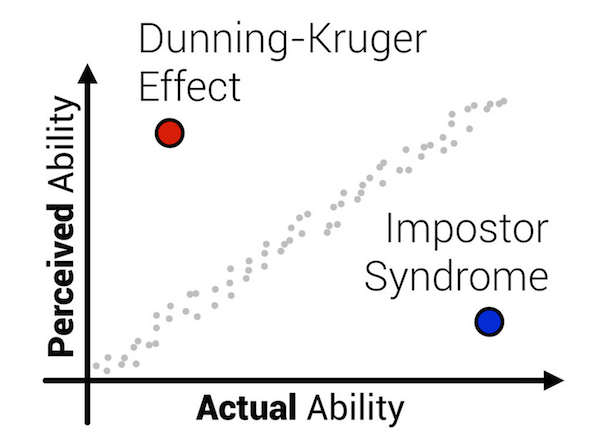
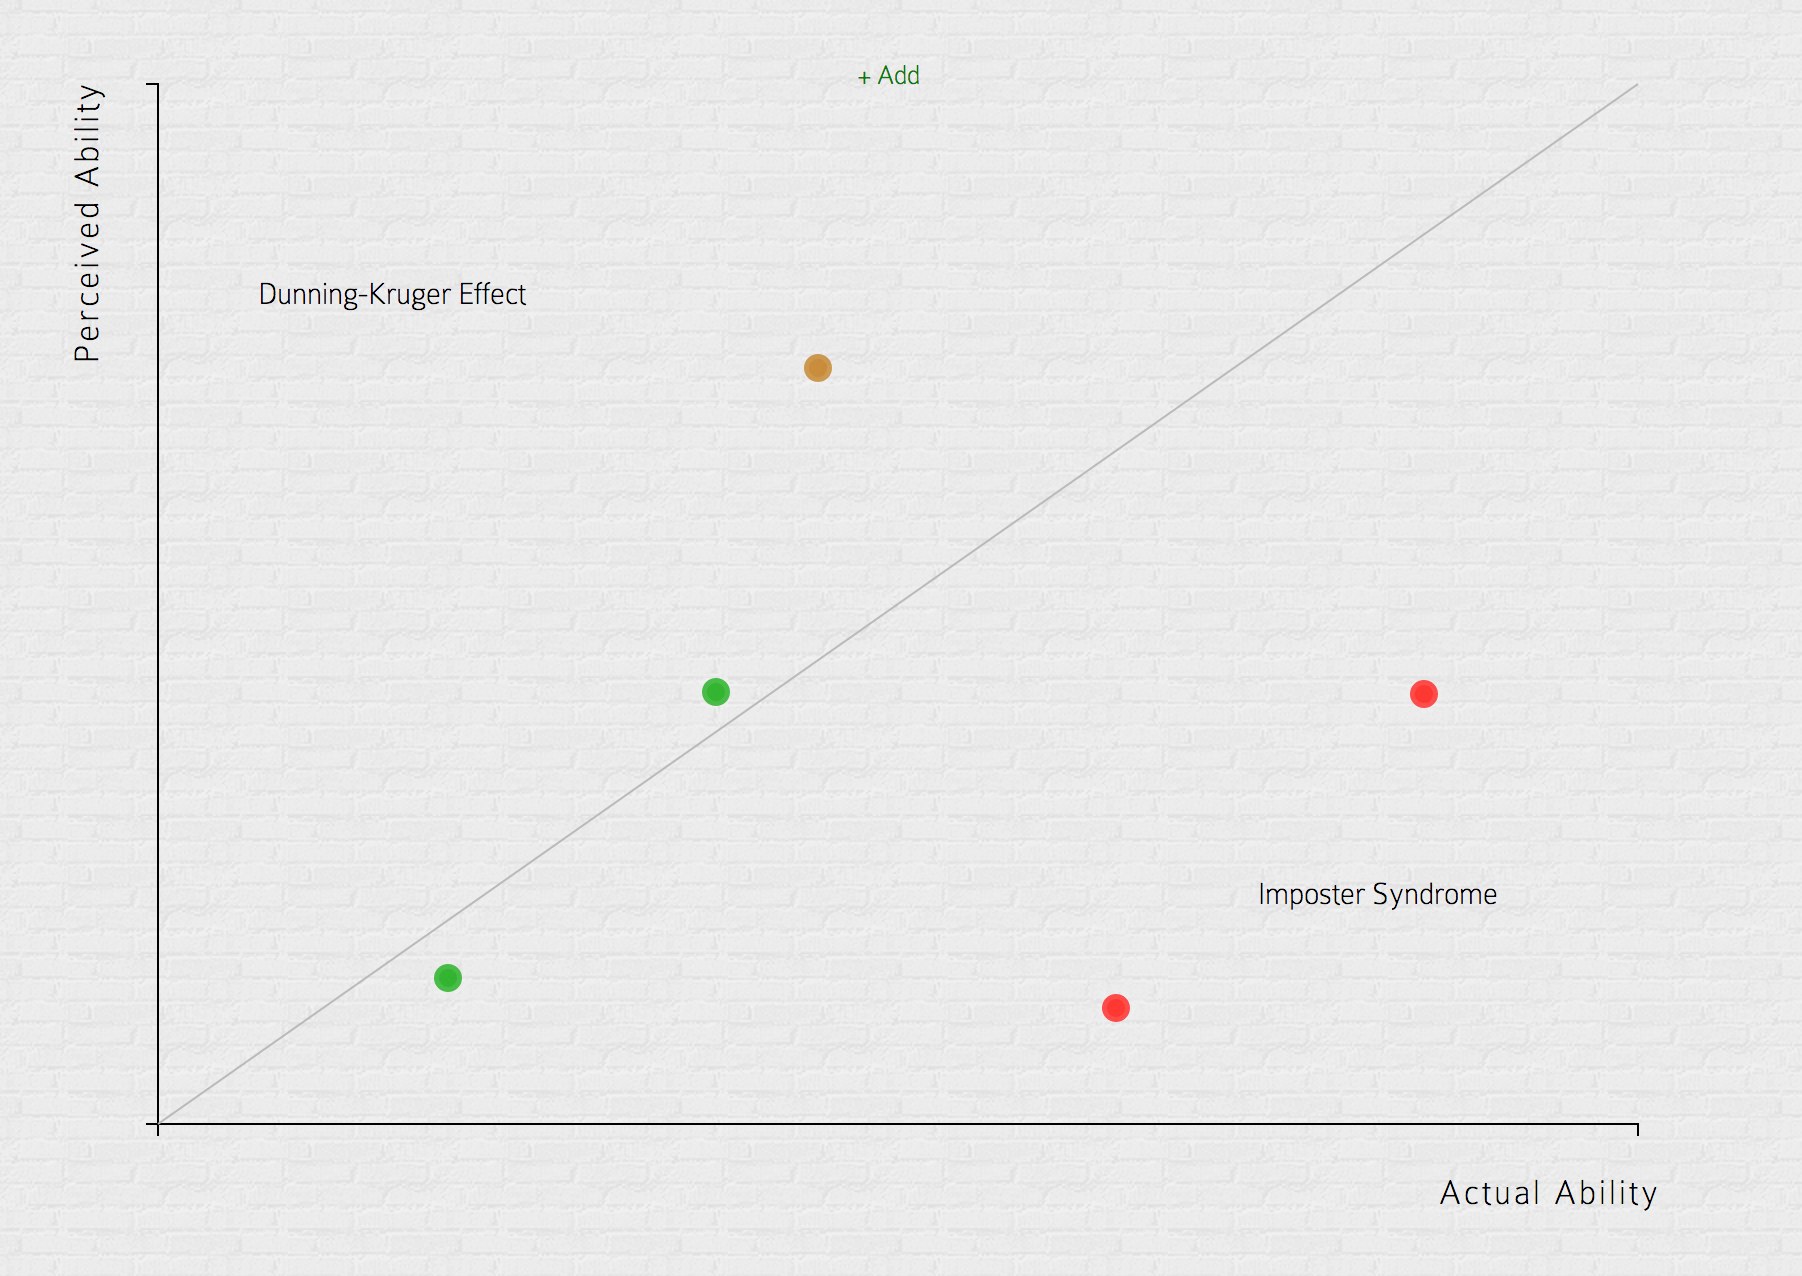
Look at the below image and read through Dunning-Kruger Effect and Imposter syndrome. It actually explains all. But the important questions is, Where are you? Leaning towards the red dot or the blue one?

I have built a tool to find it out. Feel free to find where you are…
Usage Instructions:
- Decide on what to measure (Learning a new programming language, Fixing a bug, creating a POC, spiking out an idea)
- Before you pick it, think how hard it is going to be to get it done (how able you think)
- Do it
- After done, see how hard it actually was (how able you are)
- Plot it in the above graph (you can think of both the axis as task size)
NOTE: Uses your google id to store your data


